schismCheck (input visualization)
-
one can find the location of
schismcheckby executing the following code. Then, running it in your schism run directory
python -c "from pylib import *; print(path_scripts+'/schismcheck')". For ealier pylibs versions, use
python -c "from pylib import *; print(mylib.__file__[:-16]+'Scripts/schismcheck')" -
schismcheckis still under development/testing mode (please report bugs either on SCHISM maillist or to wzhengui@gmail.com), but it is now able to view most of SCHISM inputs in different ways. It is a good way of sanity check for your model inputs. So far, 5 types of inputs are supported (see figures below). -
dimension operations
the following dimension opertations are provided for the data.schismcheckcan only plot 1D or 2D data, which will plot as time series, 2D contour plot, or scatter plot.all: extract all data along dimensionmean: compute mean value along dimensionmin: compute minimum value along dimensionmax: compute maximum value along dimensionsum: compute sum of value along dimensionnumber (0-n): extract data slice along dimension
note:alloperation will add an one dimension to your data to be plotted.
-
*.gr3, hgrid.ll, *.ic, *.prop: Plot value as contour. SCHISM grid and boundary can be superposed.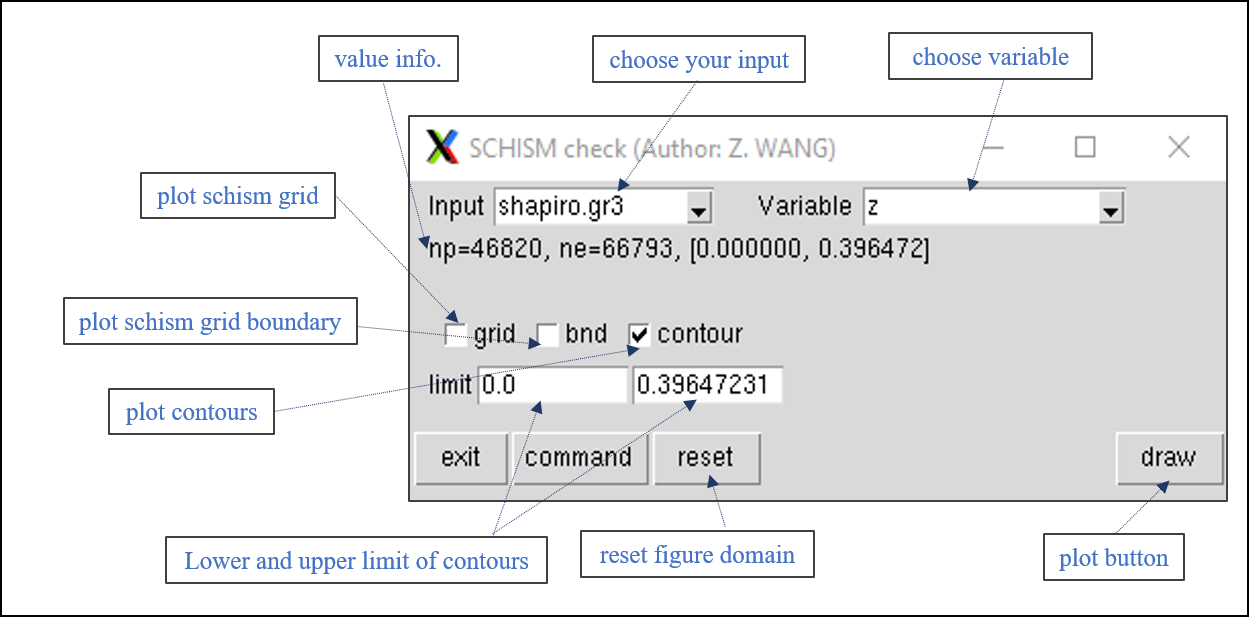
-
*_nu.nc, *_th.nc: After data (1D or 2D) is extracted, it will be plotted as time series or 2D contour. For nudge 1D data, it can also be plotted on schism grid.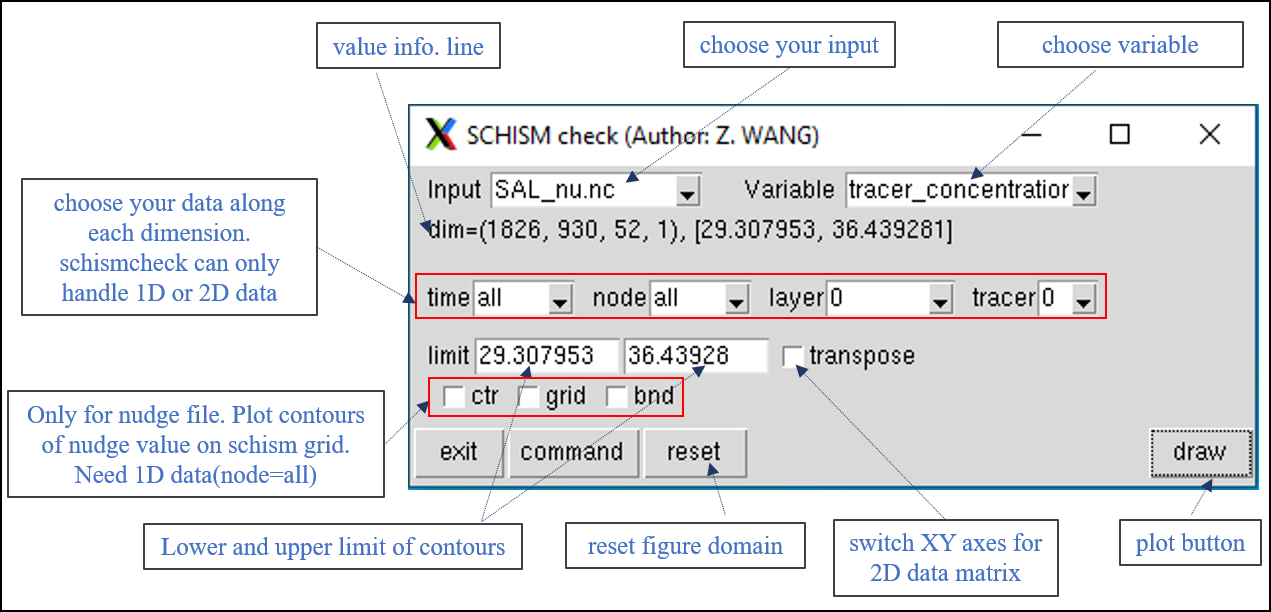
-
hotstart.nc: data will be plotted as time series or 2D contour; For 1D data with dimension=node or elem, it will be plotted as contours on schism grid.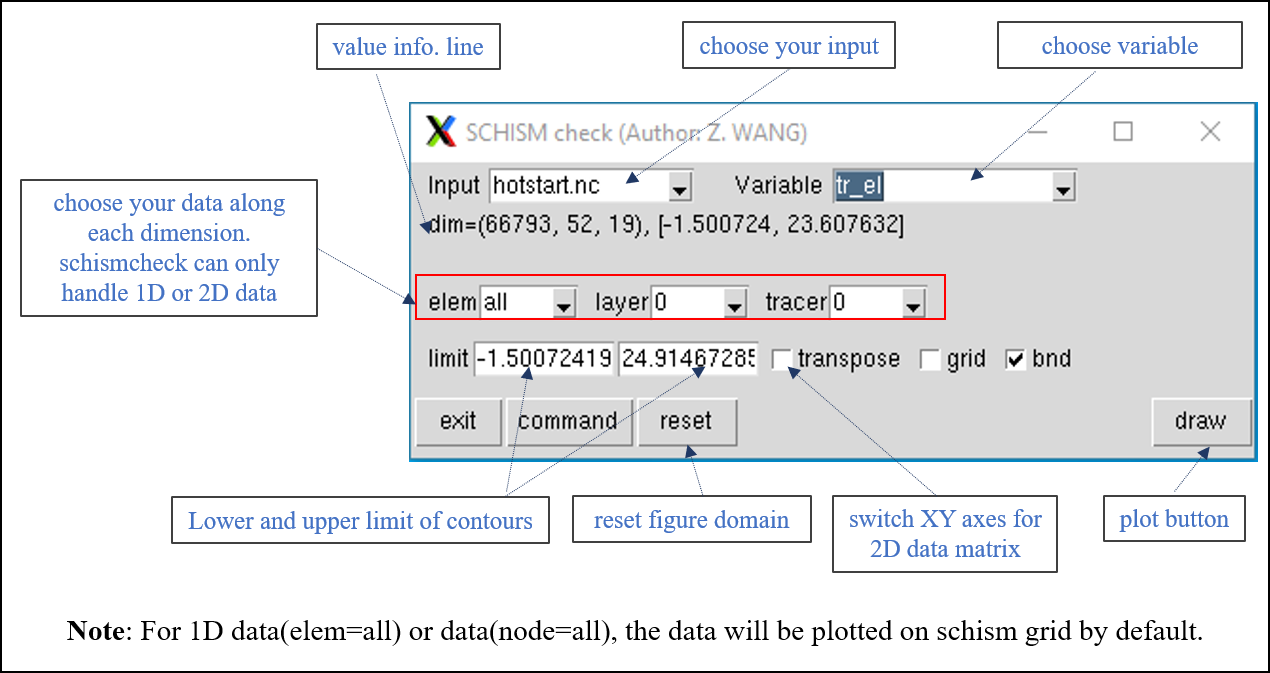
-
source.nc or source_input (source_sink.in, vsource, msource, vsink): data will be plotted as time series or 2D contour; For 1D data with dimension=source_number, it can be plotted as scatter points on schsim grid.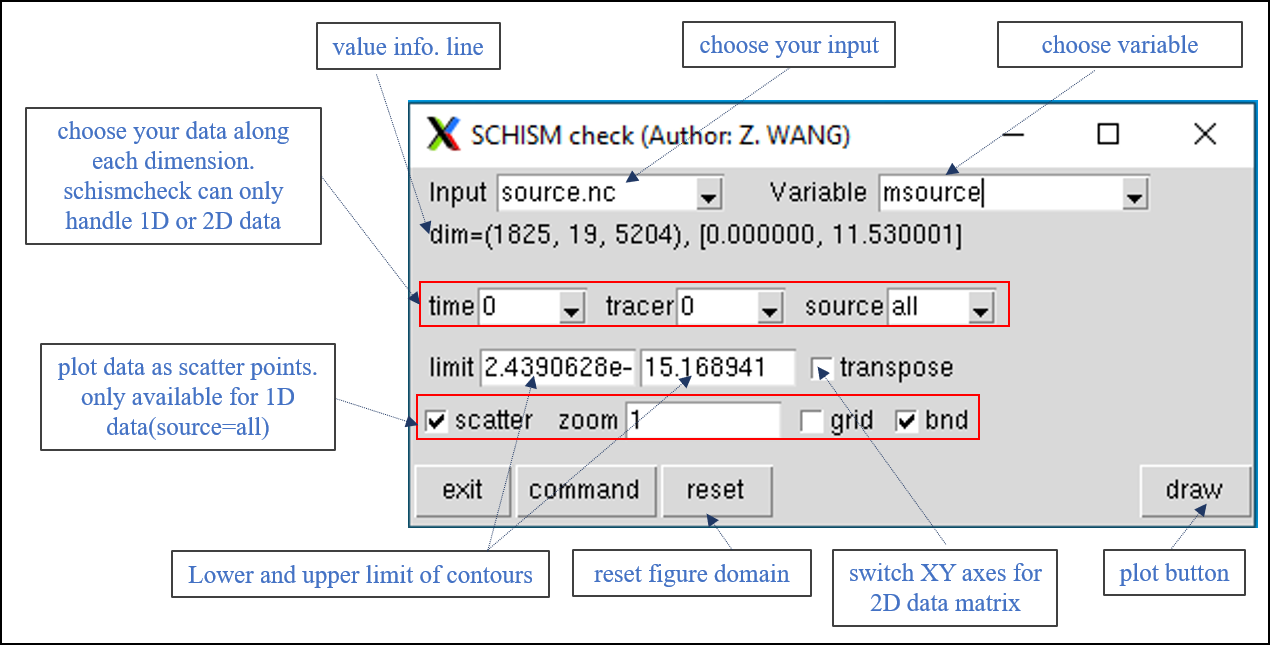
-
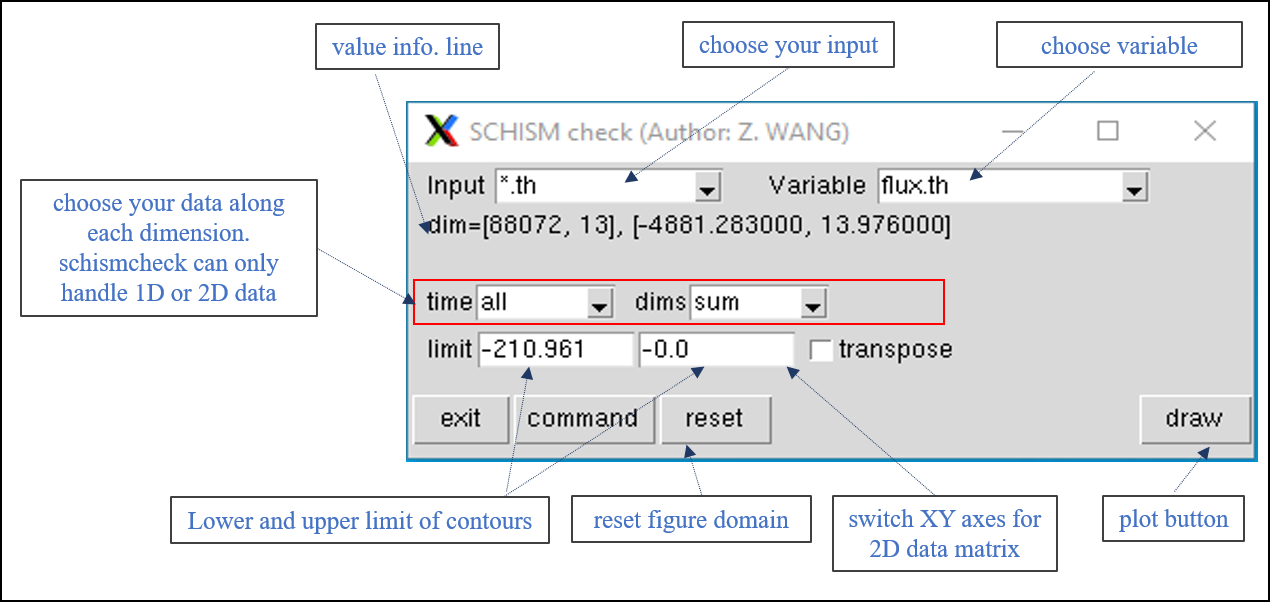
*.th: data will be plotted as time series (1D data) or 2D contour (2D data)